Lab notes · 2026-09-28
Public resolvers can leave from almost anywhere. Their queries come from a few places.
An egress map of a public resolver shows where the resolver can ask from. It does not show where it asks from. We measured both on our own lab and they are far apart.
The setup: 941 RIPE Atlas probes on 24 September, between 07:46 and 08:01 UTC, 28 measurements. Each probe asked six public resolvers, over IPv4 and IPv6, for a unique name in a zone that only our anycast nodes serve. Every answer carries the name of the node that received the resolver's query, so it says where that resolver's egress landed for that probe. A second query to a whoami service returned the egress address itself, which we mapped to its origin ASN. Answers that did not come from one of our nodes, or that looked intercepted, are not counted.
The resolvers: Google Public DNS, Cloudflare, Quad9, OpenDNS (Cisco Umbrella), AdGuard DNS and Control D. The probe set is the same kind as in "Atlas tells you where a network goes": drawn per country in proportion to population, 114 countries, 1,000 booked, 941 with results.
The other side is the traffic from that note: the queries our nodes actually answered from the resolvers' registered ASNs, 20 September 21:28 UTC to 23 September 12:00 UTC, after removing scanners and our own traffic.
What we found
Every operator leaves through many nodes, and the probes spread across them. Over IPv4, no operator sends more than 21 % of the counted probes to a single node. The three largest nodes per operator:
Resolver Top three nodes, share of counted probes (IPv4) Google Public DNS fra1 15.3 % (137 of 896), sao1 11.6 % (104), nrt1 10.7 % (96) Cloudflare sgp1 10.2 % (91 of 896), fra1 8.7 % (78), sao1 8.0 % (72) Quad9 sgp1 14.2 % (127 of 892), sao1 7.6 % (68), fra1 7.1 % (63) OpenDNS sao1 11.6 % (102 of 882), fra1 11.2 % (99), bom1 9.9 % (87) AdGuard DNS sgp1 20.3 % (183 of 901), ams1 16.8 % (151), fra1 14.3 % (129) Control D sgp1 13.6 % (122 of 896), waw1 9.7 % (87), fra1 9.7 % (87) IPv6 looks the same at the top: Google fra1 16.1 %, Cloudflare sgp1 10.7 %, Quad9 sgp1 14.2 %.
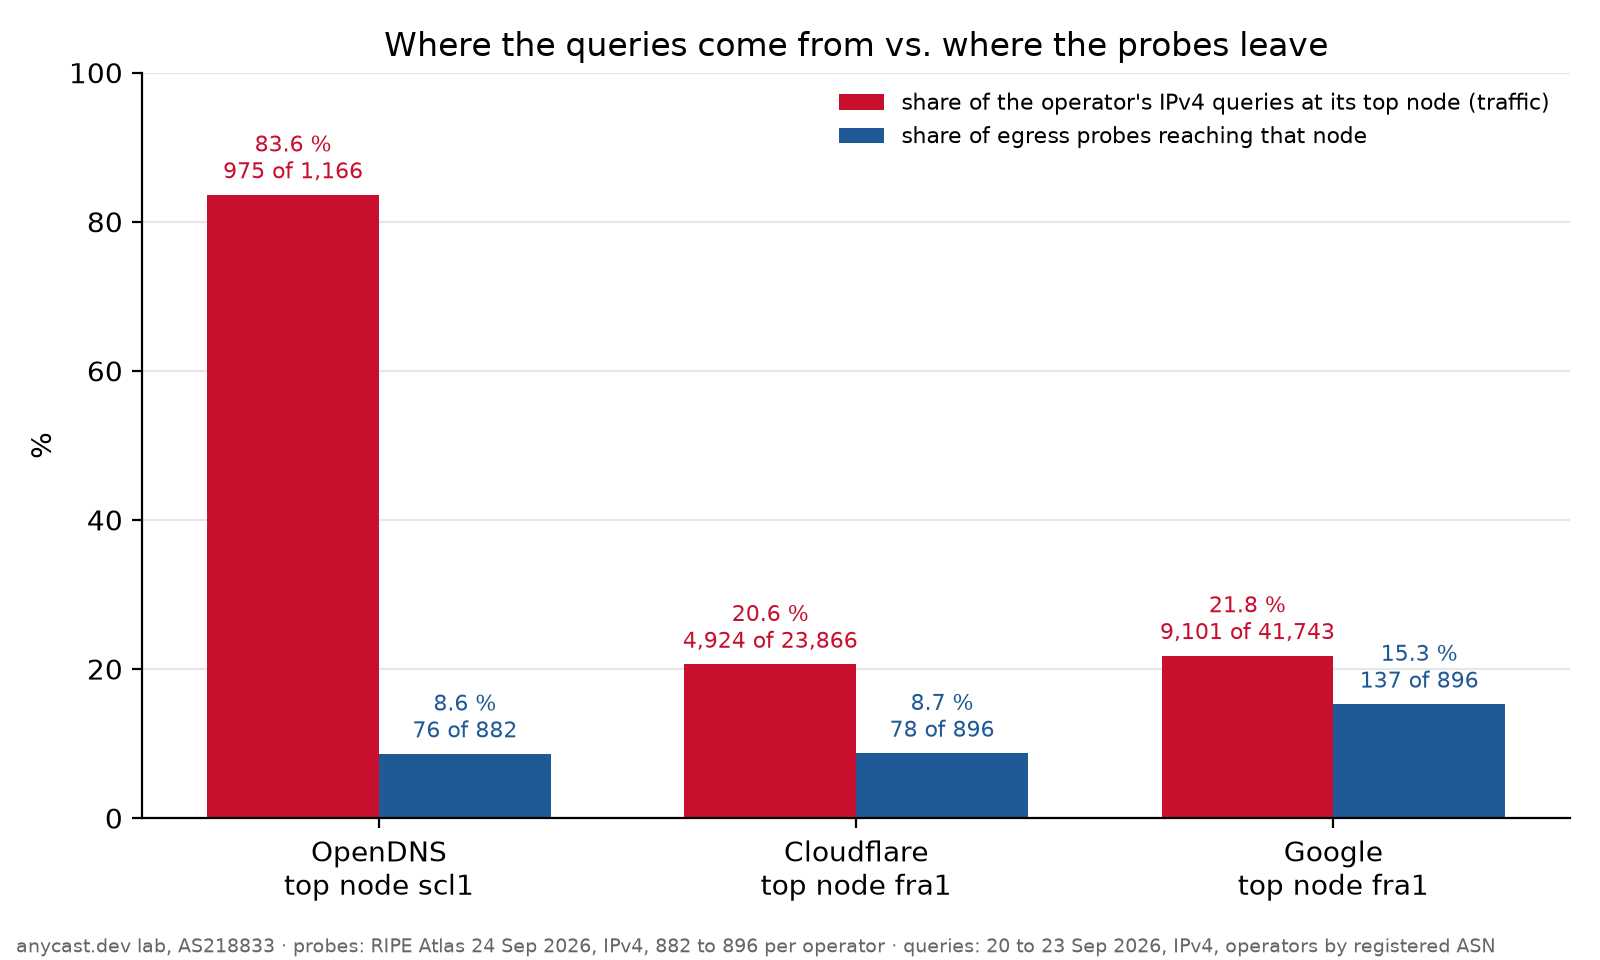
The load does not follow that spread. For the three operators we can see in the traffic, the node that gets most of their queries gets a far larger share of queries than of probes:
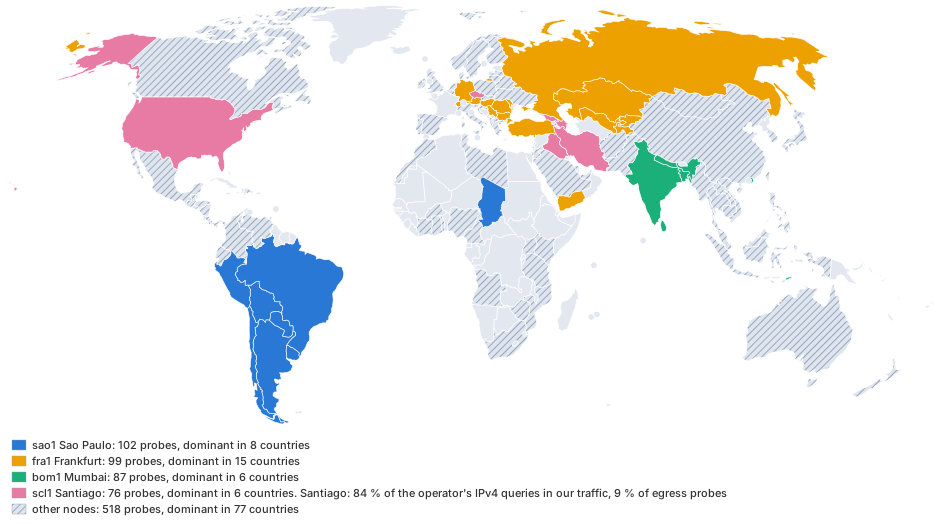
- OpenDNS: 84 % of its IPv4 queries (975 of 1,166) arrived at scl1 in Santiago. Only 9 % of the OpenDNS egress probes (76 of 882) land there.
- Cloudflare: 21 % of its IPv4 queries (4,924 of 23,866) arrived at fra1 in Frankfurt, against 9 % of the Cloudflare egress probes (78 of 896).
- Google: 22 % of its IPv4 queries (9,101 of 41,743) arrived at fra1, against 15 % of the Google egress probes (137 of 896).
It works the other way round, too. The largest OpenDNS egress node by probes, sao1 in São Paulo (11.6 %), received 46 of the 1,166 OpenDNS queries. Frankfurt, second by probes (11.2 %), received none. Google's second egress node, sao1 (11.6 % of probes), got 5 % of Google's IPv4 queries (2,222 of 41,743).
Quad9 leaves through 78 different ASNs. Over IPv4 the counted Quad9 probes exit through 78 origin ASNs, the largest being AS42 (WoodyNet, 286 probes), AS49544 (i3D.net, 195) and AS7195 (EdgeUno, 116). Under its own registered ASN, AS19281, our traffic shows no queries at all.
AdGuard DNS and Control D leave through the same hosting provider. AdGuard's counted IPv4 probes exit through AS60068 and AS212238, both registered to Datacamp Limited (886 of 901). Control D exits mostly through AS212238 as well (793 of 896). Both have their largest share at sgp1.
Three of the six operators are invisible in the traffic. We assign traffic to operators by registered ASN. Quad9 barely uses its own, and AdGuard DNS and Control D leave through hosting networks that we do not count as resolvers. Their queries are in the traffic, but not under their names. The resolver share in the earlier note is therefore a lower bound, and so are the traffic columns above: they cover Google, Cloudflare and OpenDNS only.
Why the two differ
The probes measure where a resolver's egress can land, one query per probe. The traffic measures where the queries actually land, weighted by how often each egress point asks. A node that many probes reach can still see little traffic if the users behind those probes are few, or if the resolver answers most of their questions from its cache.
That last part is a hypothesis. We have not measured cache behaviour, and the numbers above do not separate "few users" from "warm cache". What they do show is that a count of probes per egress node is not a forecast of load per node.
What this does not show
- One Atlas run, one query per probe, resolver and address family, 24 September 07:46 to 08:01 UTC. Resolver egress can change from one query to the next.
- The traffic is from a different window, 20 to 23 September, and from one traffic profile: parking zones, mostly registered in Europe, with little end user traffic.
- The probe set is weighted by population. That is right for asking where users' resolvers leave, and wrong for predicting traffic, as the earlier note showed.
- The node and the egress address of a probe come from two separate measurements. A change of egress between the two is not ruled out.
- Operators are assigned by registered ASN, from RIPEstat on 24 September for the egress addresses and from iptoasn.com for the traffic. The traffic shares cover three operators and are a lower bound for public resolvers as a whole.
- Nothing here says where these resolvers leave for zones on other anycast networks. It says where they reach ours.
Data: RIPE Atlas measurements 215153307, 215153308, 215153314 to 215153328, 215153331 to 215153337 and 215156026 to 215156052 (28 measurements), 24 September 2026 07:46 to 08:01 UTC, 941 probes. Egress ASNs from RIPEstat prefix-overview, 24 September 2026. Traffic: our own nodes on AS218833, 20 September 21:28 UTC to 23 September 12:00 UTC, source addresses truncated to /24 and /48, ASNs from iptoasn.com. RIPE Atlas data from atlas.ripe.net; where our numbers and theirs disagree, theirs are right.