Lab notes · 2026-09-25
Atlas tells you where a network goes. It does not tell you how much traffic arrives.
We checked one against the other on our own lab: the catchment that RIPE Atlas probes report for each node, next to the resolver traffic the same nodes actually answered.
The data: 34 lab nodes on one anycast prefix, 62.5 hours of resolver traffic to a set of European parking zones (20 September 21:28 UTC to 23 September 12:00 UTC), 150,024 queries after cleaning, from 7,934 source prefixes in 1,451 ASNs. On the Atlas side, one run an hour before the traffic window, 933 probes over IPv4 and 946 over IPv6, drawn per country in proportion to population.
Cleaning matters here. Only queries for zones the nodes actually serve count, prefixes that hit many nodes like a scanner are removed, and so is our own traffic, including the Atlas measurement itself. Without that last step a probe partly "finds" its own queries, and the agreement looks far better than it is.
What we found
Atlas gets the breadth right. Rank the 34 nodes by their share of Atlas probes and by their share of distinct source ASNs in the traffic: the rank correlation is 0.81. To make the two distributions identical you would have to move 23.5 % of the mass. Which networks end up at which node, Atlas sees reasonably well.
A single probe matches its own network about half the time, and mostly when the network is simple. For every network with traffic and at least one probe we took the node that got most of that network's queries and asked whether the probe landed there. Over all 628 such probes: 58 % (367). In networks that send at least 80 % of their queries to one node: 82 % (310 of 378). Networks with more traffic spread it over more nodes, and one probe only sees its own corner.
Three public resolvers send at least 56 % of the queries, and Atlas has one probe inside them. 84,808 of the 150,024 queries come from the registered ASNs of Google, Cloudflare and OpenDNS, 80,238 of them from Google and Cloudflare alone. Inside those networks Atlas has exactly one usable probe. "At least", because we assign operators by registered ASN: Quad9 leaves through 78 different ASNs and sends only 559 queries under the ASNs registered to it, and AdGuard, Control D and DNS4EU do not show up under a resolver ASN at all.
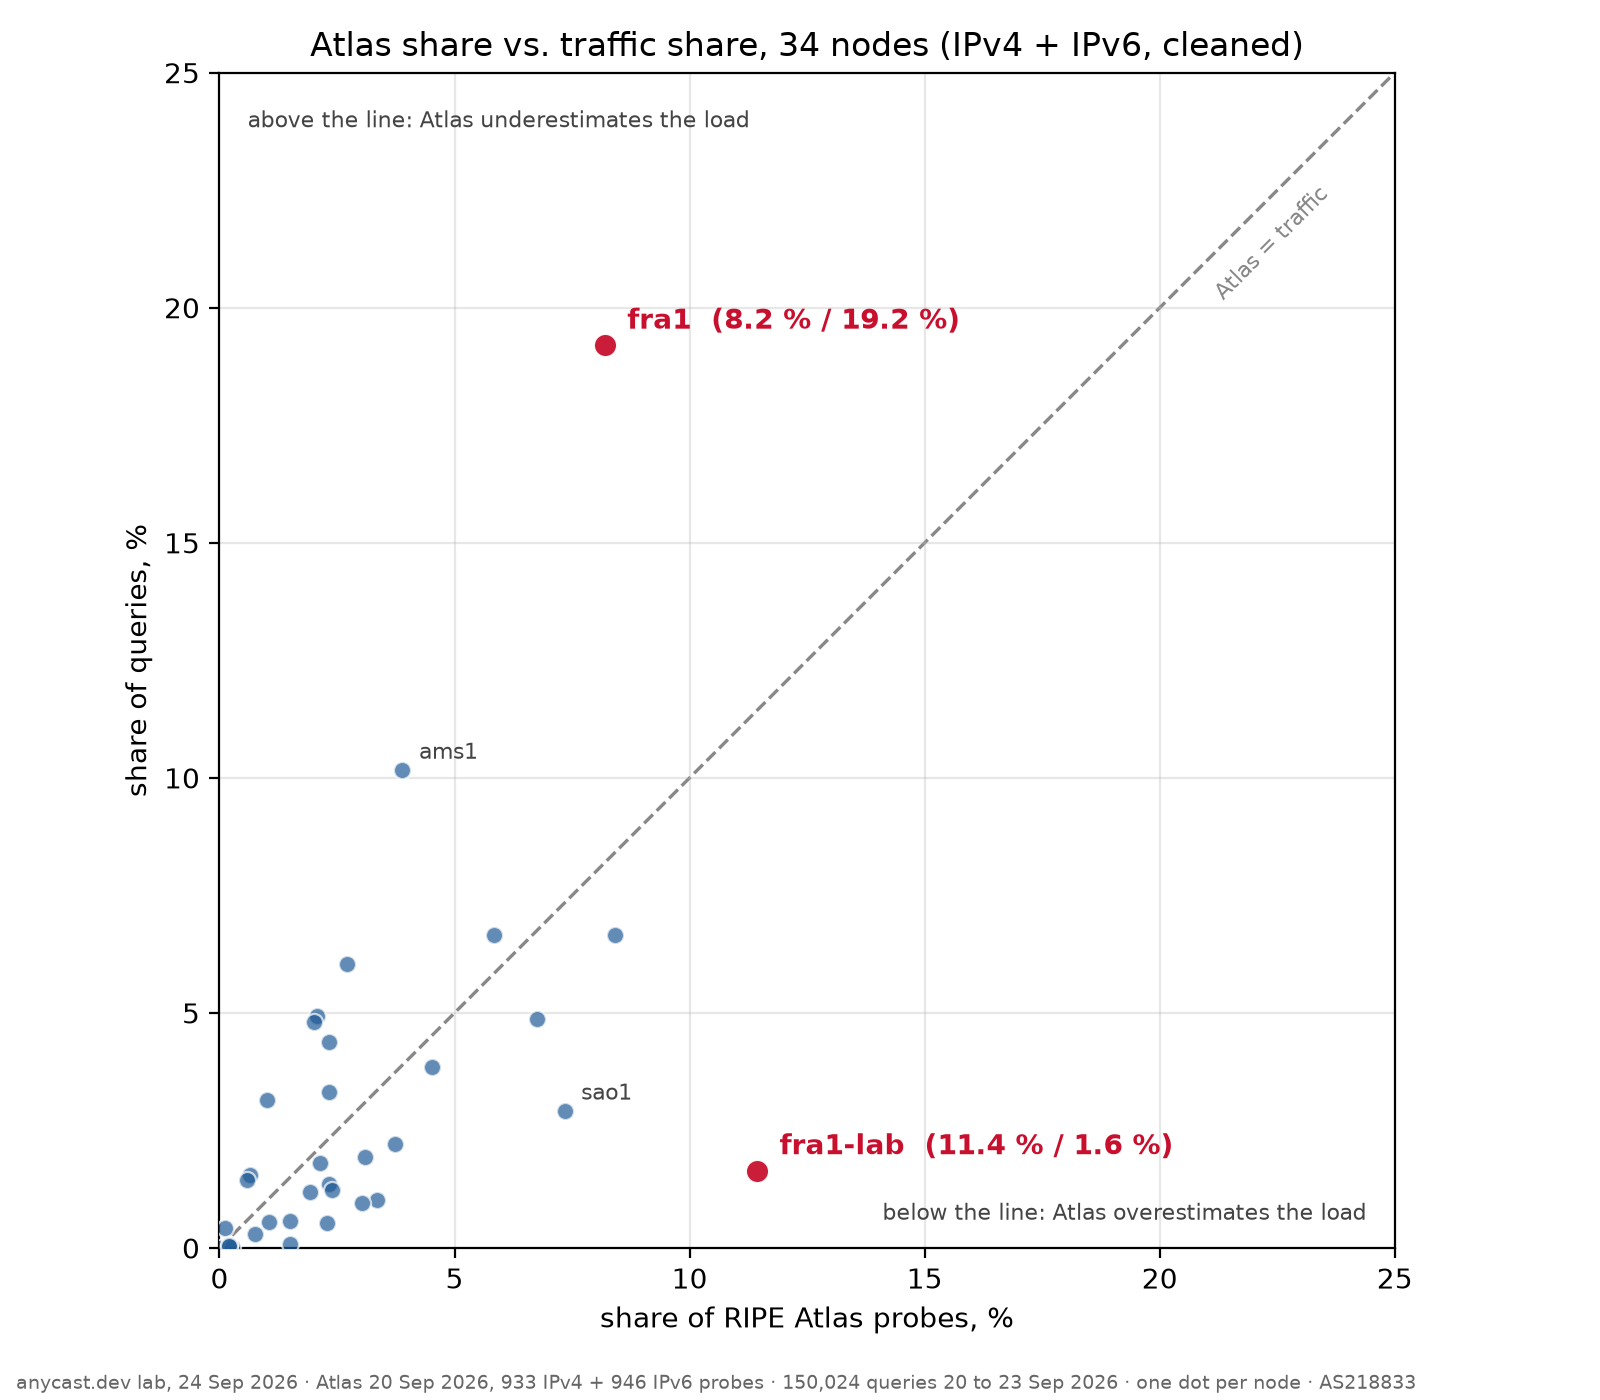
Frankfurt is where the two views disagree most, in opposite directions. Our Vultr node in Frankfurt (fra1) gets 8.2 % of the Atlas probes and 19.2 % of the queries: Atlas underestimates it by 11.0 points. Our second Frankfurt node, at Virtua (fra1-lab), gets 11.4 % of the probes and 1.6 % of the queries: Atlas overestimates it by 9.8 points. The public resolvers concentrate on fra1; the networks that Atlas sends to fra1-lab are many and quiet.
Right catchment, wrong load: fra1-lab over IPv6. 22.2 % of the IPv6 probes land at fra1-lab. In the traffic, fra1-lab holds 16.7 % of the IPv6 source ASNs, but only 6.3 % of the IPv6 queries (1,764 of 27,834). The networks are largely where Atlas says they are. They just do not ask much.
Weighting by population makes every traffic comparison worse. Against queries, the rank correlation drops from 0.71 with raw probe counts to 0.575 with population weights. Population is where users are, not where resolver traffic for these zones comes from.
What comes next
Even the resolvers' own egress points, measured per Atlas probe on 24 September, do not match where their load lands. That note follows in this series.
What this does not show
- One traffic profile: parking zones, mostly registered in Europe, with little end user traffic. For a zone with real users, a ccTLD for example, the share of the public resolvers can be quite different.
- One Atlas measurement, on 20 September, one question per probe, no repetition. The traffic ran from 20 to 23 September; routing changes in that window are not taken out.
- Operators are assigned by registered ASN. The resolver share is a lower bound, not an estimate.
- Nothing here says how well Atlas predicts load for zones with real end user traffic. That needs an operator's own traffic next to the same probes.
Data: RIPE Atlas measurements 213484924 (IPv4) and 213484927 (IPv6), 20 September 2026 20:23 UTC. Traffic: our own nodes on AS218833, 20 September 21:28 UTC to 23 September 12:00 UTC, source addresses truncated to /24 and /48, ASNs from iptoasn.com. RIPE Atlas data from atlas.ripe.net; where our numbers and theirs disagree, theirs are right.