Lab notes · 2026-09-27
Which nameserver do resolvers pick, and how fast do they move
78 zones, delegated to one unicast server and to 34 anycast nodes at the same time. For 24 hours we counted where the resolvers sent their queries, and in a separate test how long they take to follow a change.
Why this measurement
Our own domains are delegated to two nameserver names. ns.portalix.net is one server, one address per family, in Germany. ns.portalix.org is our lab anycast network, 34 nodes on several continents. Both names serve the same 78 zones and give the same answers. A resolver that looks up one of these zones gets both names from the parent and can ask either.
The common expectation is that the anycast name wins: it is nearer to almost everyone, so a resolver that measures round trips should move most of its queries there. We counted whether it does.
Findings
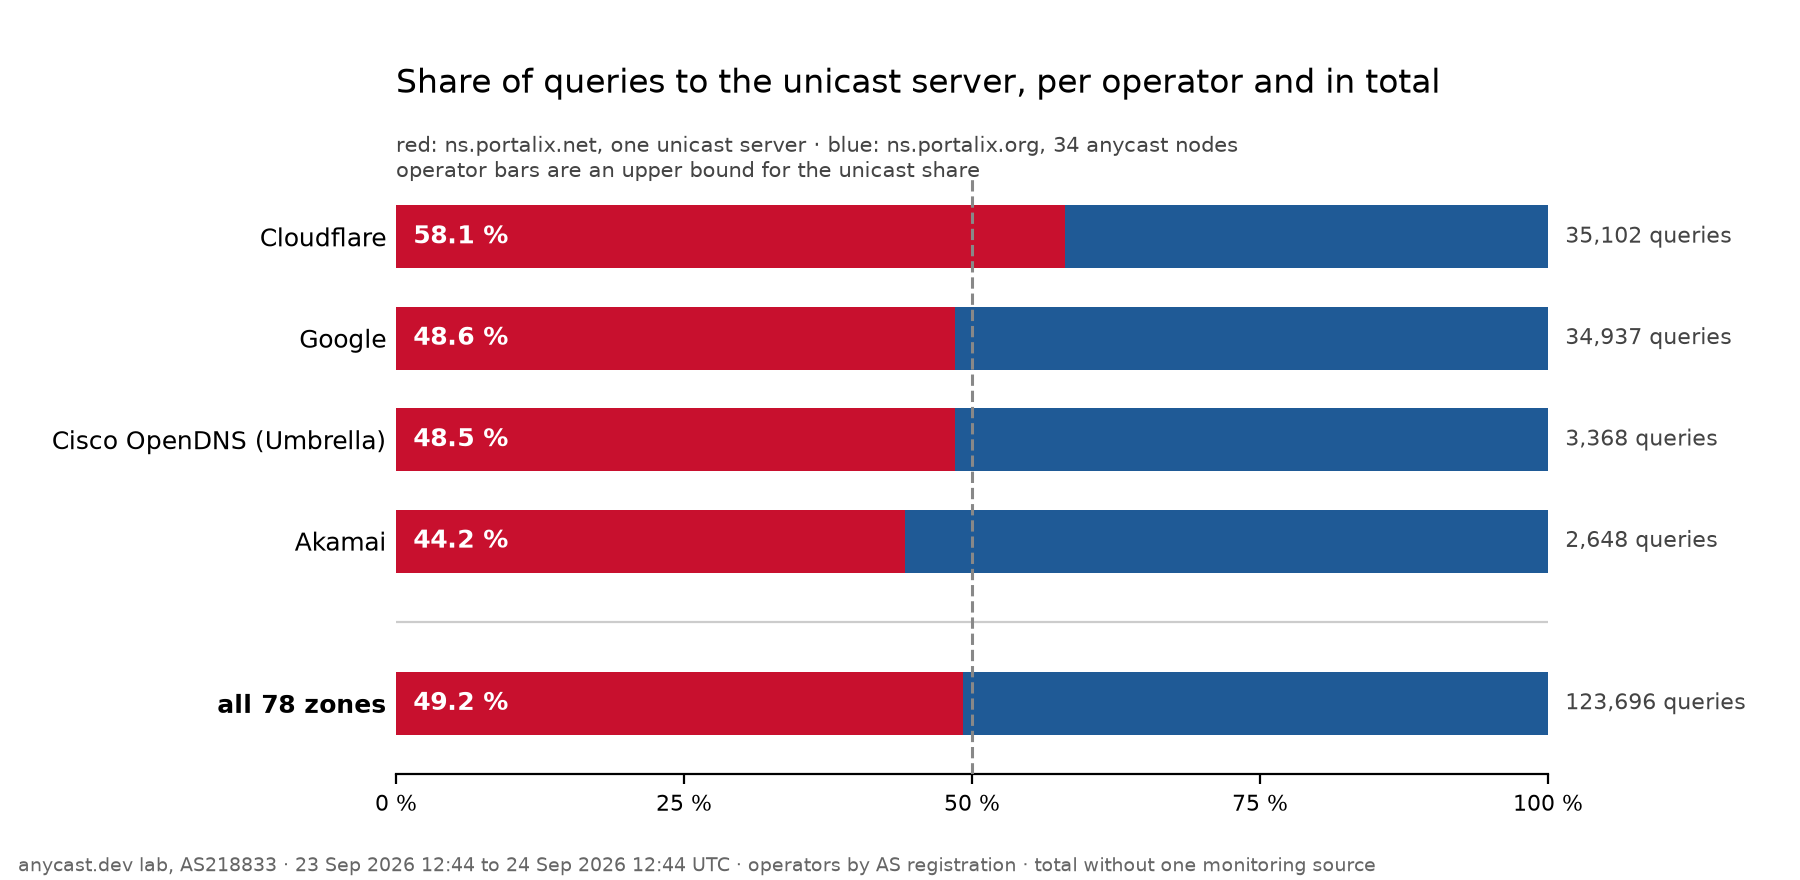
The large resolvers split their queries roughly in half. From 23 September 12:44 to 24 September 12:44 UTC, per operator (network as registered to the AS number), queries at the unicast server against queries at the 34 anycast nodes:
- Cloudflare: 20,387 against 14,715, 58.1 % to the unicast server.
- Google: 16,962 against 17,975, 48.6 %.
- Cisco OpenDNS (Umbrella): 1,635 against 1,733, 48.5 %.
- Akamai: 1,170 against 1,478, 44.2 %.
These shares are upper bounds for the unicast side. The anycast counts have our scanner rule applied (a source that hits five or more nodes in one hour, or ten over the whole period, is removed); the unicast capture could not apply it, because one server cannot see a source hitting many nodes. For the egress networks of large public resolvers, scanner traffic is implausible, so for these four the bias is small. For small networks it is not, which is why they are not in this list.
All zones together: 49.2 % to the unicast server. Counting only queries for the 78 zones, with our own networks removed on both sides and no scanner rule on either side: 60,853 queries at the unicast server against 62,843 at the anycast nodes. One network that sent almost all of its queries to the unicast server and almost none to the anycast nodes is left out of this count on both sides; it behaves like a single monitoring source, not like a resolver, and with it the share is 55.9 %. The loosest comparison, everything the unicast server received from outside our networks against the cleaned anycast count, gives 61.4 %; that is the ceiling.
IPv4 and IPv6 look the same. Same count as in 2: 49.6 % on IPv4 (48,465 against 49,334), 47.8 % on IPv6 (12,388 against 13,509).
Anycast did not win the race to be the faster nameserver. One server in one country takes about as many queries from the big resolvers as 34 nodes spread around the world.
Why, perhaps
We did not measure the cause. Two hypotheses, both unverified:
- Resolvers pick a nameserver by smoothed round trip time and keep probing the others. If both names answer in a few milliseconds from where the resolver sits, the difference is inside the noise and the choice stays close to even.
- The egress sites of the large resolvers that send most of this traffic may be close to the unicast server, so the anycast name has no distance advantage to offer them.
Either would fit the numbers. Neither is shown by them.
How fast resolvers follow a change
A second test on the same names. On 23 September at 20:45 UTC we pointed the address records of ns.portalix.org (TTL 300 seconds) from the 34 lab nodes to a separate set of four nodes, and at 21:45 UTC back again. The delegation itself did not change, only where the name points.
Definition: the new side "has it" at the first minute in which it carries at least 99 % of that minute's queries and keeps doing so for the next five minutes, counted from the moment the record was written, one-minute resolution.
- Away from the lab nodes: IPv4 after 2.9 minutes, IPv6 after 1.9 minutes.
- Back to the lab nodes: IPv4 after 1.9 minutes, IPv6 after 1.9 minutes.
A change with TTL 300 is through in under three minutes, in both directions and both families. That is what the TTL promises; now it is measured on real resolver traffic rather than on test probes.
What this does not show
- It does not show which name is faster for users. We counted where queries went, not how long they took.
- It does not show why resolvers split the way they do (see above).
- The unicast shares per operator are upper bounds, not point values (finding 1).
- It is one day, one unicast server in one country and one anycast network. A unicast server elsewhere, or an anycast network with other sites, can split differently.
- The switch test is one switch in each direction at one hour of the day. It says nothing about resolvers that ignore the TTL.
What comes next
The unicast server also receives a steady stream of queries for domains we no longer host but whose parent zones still point at our names. That is material for a follow-up to "What the delegation costs", not for this note.
Data: unicast side: packet capture on ns.portalix.net, 23 Sep 2026 12:44:48 to 24 Sep 2026 12:44:43 UTC, 124,509 queries, 99,813 from outside our own networks, 79,766 of them for the 78 zones; queries sent by the server itself (zone refresh) removed. Anycast side: per-minute dnstap aggregates from the 34 lab nodes on AS218833, same window, own networks removed; per-operator counts with the scanner rule (62,647 queries for the 78 zones), totals without it (62,855). Operators by AS registration. Switch test: 23 Sep 2026, 20:30 to 23:15 UTC, both sides with the scanner rule; one zone whose glue sits in the parent zone left out.